'%3e%3cpath%20d='M422.855%200H315.186L331.103%2026.7375H346.784H374.482L321.817%20116.499L338.591%20144L422.855%200Z'%20fill='%233982F7'/%3e%3cpath%20d='M286.707%200H252.768L307.383%2093.1989L324.547%2063.7878L286.707%200Z'%20fill='%233982F7'/%3e%3cpath%20d='M422.855%200H315.186L331.103%2026.7375H346.784H374.482L321.817%20116.499L338.591%20144L422.855%200Z'%20stroke='%233982F7'/%3e%3cpath%20d='M286.707%200H252.768L307.383%2093.1989L324.547%2063.7878L286.707%200Z'%20stroke='%233982F7'/%3e%3cpath%20d='M28.4707%20108.591V44.9568H4.34668V32.5775H66.0694V44.9568H41.9454V108.591H28.4707ZM140.979%2098.3831C133.445%20106.057%20123.918%20109.894%20112.4%20109.894C100.881%20109.894%2091.3906%20106.093%2083.9289%2098.4917C76.4671%2090.8904%2072.7363%2081.5878%2072.7363%2070.5841C72.7363%2059.725%2076.5032%2050.4588%2084.0376%2042.785C91.5718%2035.1112%20101.098%2031.2744%20112.617%2031.2744C124.136%2031.2744%20133.626%2035.0751%20141.088%2042.6764C148.549%2050.2777%20152.28%2059.5803%20152.28%2070.5841C152.28%2081.4431%20148.513%2090.7093%20140.979%2098.3831ZM94.035%2089.8045C98.9611%2095.0168%20105.155%2097.623%20112.617%2097.623C120.079%2097.623%20126.2%2095.0168%20130.982%2089.8045C135.835%2084.5922%20138.262%2078.1854%20138.262%2070.5841C138.262%2063.0552%20135.799%2056.6845%20130.873%2051.4722C126.019%2046.1874%20119.861%2043.5451%20112.4%2043.5451C104.938%2043.5451%2098.7799%2046.1513%2093.9263%2051.3636C89.145%2056.5759%2086.7543%2062.9827%2086.7543%2070.5841C86.7543%2078.1129%2089.1811%2084.5197%2094.035%2089.8045ZM168.429%20108.591V32.5775H198.421C207.259%2032.5775%20214.286%2034.894%20219.502%2039.5273C224.718%2044.1605%20227.326%2050.3863%20227.326%2058.2048C227.326%2066.3852%20224.429%2072.7559%20218.633%2077.3166C212.91%2081.8774%20205.666%2084.1578%20196.9%2084.1578H181.795V108.591H168.429ZM181.795%2072.1043H197.334C202.333%2072.1043%20206.318%2070.8374%20209.288%2068.3037C212.258%2065.77%20213.743%2062.4398%20213.743%2058.3134C213.743%2053.9698%20212.258%2050.6396%20209.288%2048.3231C206.39%2045.9341%20202.406%2044.7396%20197.334%2044.7396H181.795V72.1043Z'%20fill='%23E2E8F0'/%3e%3cpath%20d='M457.019%20108.591V32.5775H470.385V108.591H457.019ZM526.065%20109.894C515.052%20109.894%20505.853%20106.129%20498.464%2098.6003C491.074%2090.999%20487.38%2081.6603%20487.38%2070.5841C487.38%2059.5803%20491.074%2050.2777%20498.464%2042.6764C505.853%2035.0751%20515.234%2031.2744%20526.608%2031.2744C533.199%2031.2744%20538.779%2032.2878%20543.343%2034.3149C547.978%2036.342%20552.324%2039.274%20556.383%2043.1107L547.798%2052.9924C540.988%2046.6942%20533.889%2043.5451%20526.5%2043.5451C519.254%2043.5451%20513.242%2046.1513%20508.461%2051.3636C503.75%2056.5759%20501.398%2062.9827%20501.398%2070.5841C501.398%2078.1129%20503.788%2084.5197%20508.57%2089.8045C513.351%2095.0168%20519.328%2097.623%20526.5%2097.623C530.846%2097.623%20534.685%2096.8268%20538.018%2095.234C541.349%2093.569%20544.791%2091.0715%20548.342%2087.7413L556.926%2096.4285C552.65%20100.917%20548.124%20104.283%20543.343%20106.527C538.562%20108.772%20532.802%20109.894%20526.065%20109.894ZM633.725%2098.3831C626.192%20106.057%20616.665%20109.894%20605.146%20109.894C593.627%20109.894%20584.138%20106.093%20576.675%2098.4917C569.213%2090.8904%20565.483%2081.5878%20565.483%2070.5841C565.483%2059.725%20569.25%2050.4588%20576.784%2042.785C584.317%2035.1112%20593.845%2031.2744%20605.363%2031.2744C616.882%2031.2744%20626.371%2035.0751%20633.834%2042.6764C641.296%2050.2777%20645.027%2059.5803%20645.027%2070.5841C645.027%2081.4431%20641.259%2090.7093%20633.725%2098.3831ZM586.781%2089.8045C591.707%2095.0168%20597.901%2097.623%20605.363%2097.623C612.826%2097.623%20618.947%2095.0168%20623.728%2089.8045C628.582%2084.5922%20631.009%2078.1854%20631.009%2070.5841C631.009%2063.0552%20628.545%2056.6845%20623.619%2051.4722C618.765%2046.1874%20612.608%2043.5451%20605.146%2043.5451C597.683%2043.5451%20591.527%2046.1513%20586.673%2051.3636C581.891%2056.5759%20579.501%2062.9827%20579.501%2070.5841C579.501%2078.1129%20581.927%2084.5197%20586.781%2089.8045Z'%20fill='%23E2E8F0'/%3e%3c/g%3e%3cdefs%3e%3cclipPath%20id='clip0_207_16'%3e%3crect%20width='652'%20height='144'%20fill='white'/%3e%3c/clipPath%3e%3c/defs%3e%3c/svg%3e)
Robinhood Chain Tops Ethereum L2 Revenue Rankings With $3.21M
Robinhood Chain leads Ethereum L2 revenue at $3.21M, 56% ahead of Base's $2.06M, per DefiLlama data covering the top 10 L2s.
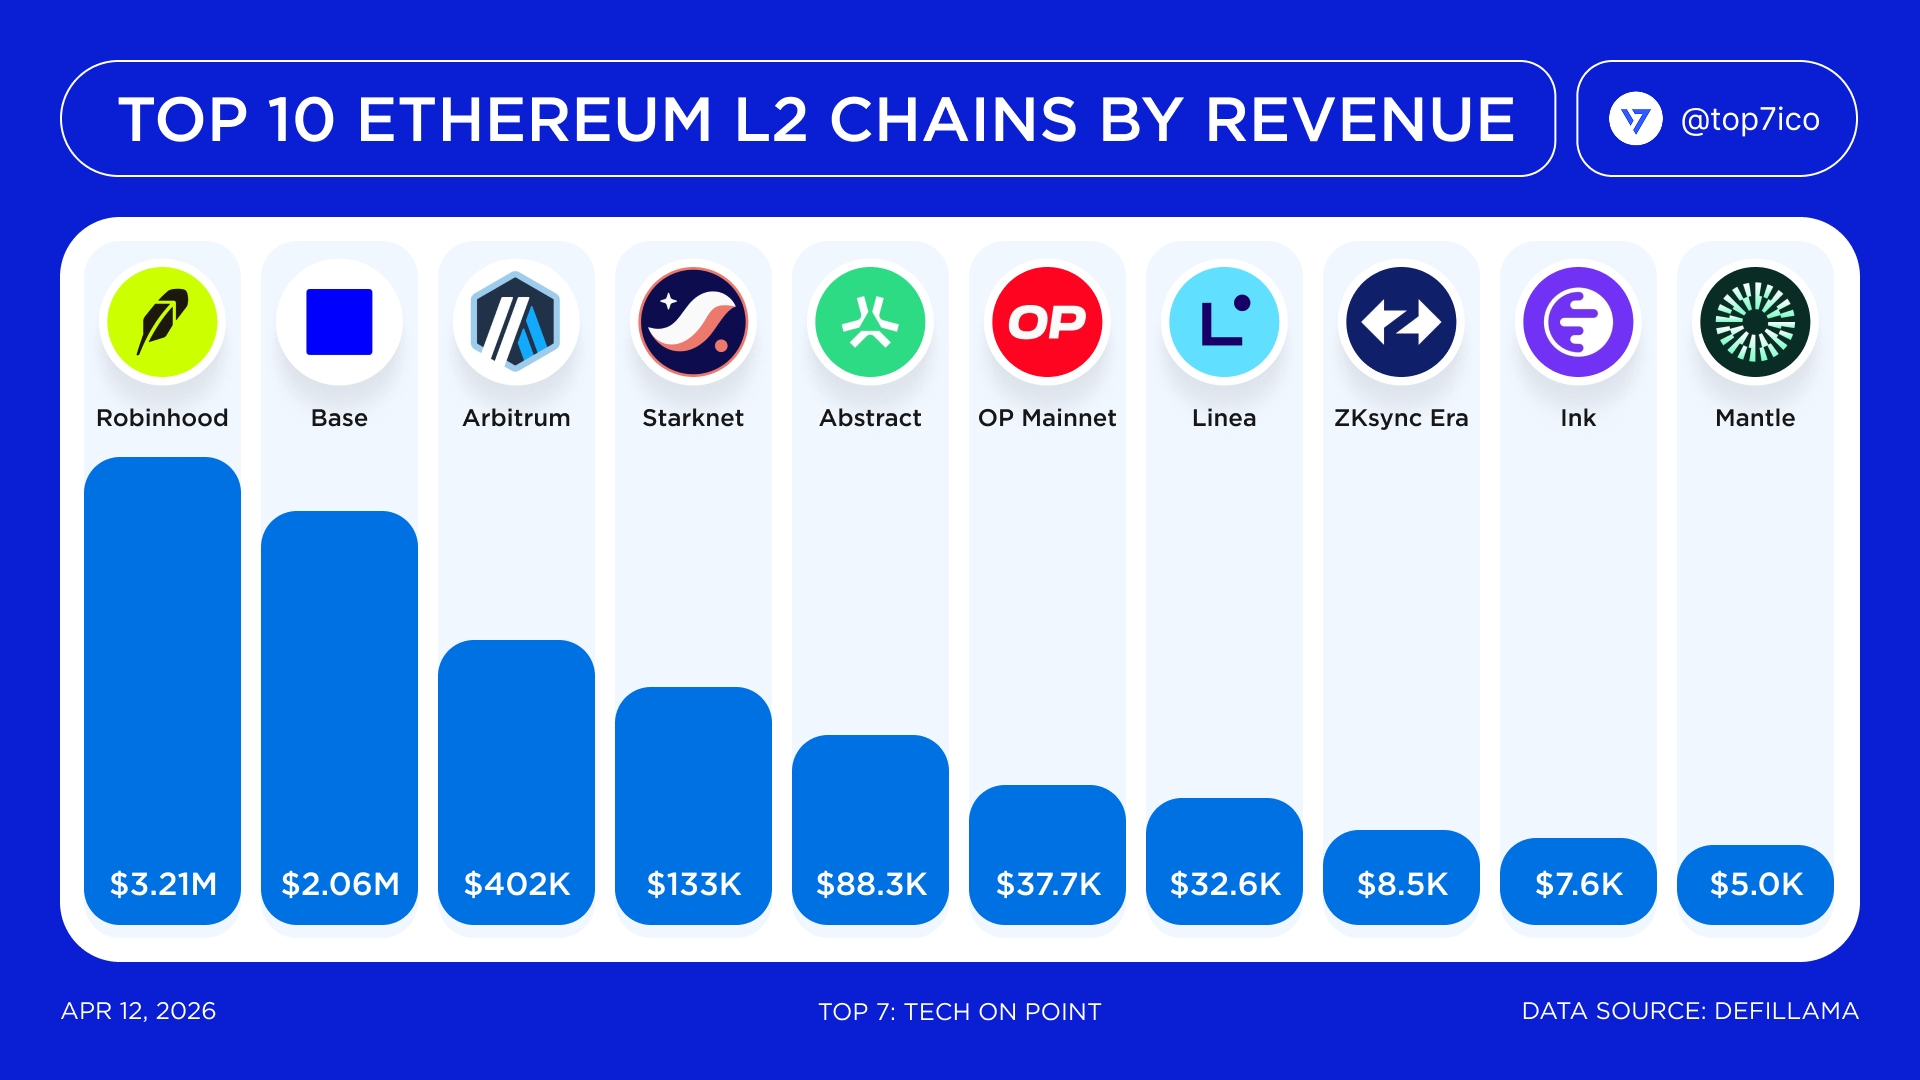
Robinhood Chain leads all Ethereum layer-2 networks in revenue with $3.21M, according to DefiLlama data compiled by Top 7 as of April 12, 2026. That figure is 56% higher than second-ranked Base's $2.06M, and together the two chains control roughly 84% of total revenue generated by the top 10 L2s tracked in the dataset — leaving Arbitrum, Starknet, Abstract, OP Mainnet, Linea, ZKsync Era, Ink, and Mantle to split the rest.
Key takeaways
- Robinhood Chain tops the list with $3.21M in revenue, ahead of Base's $2.06M by 56%.
- Robinhood and Base combined account for about 84% of the top-10 total, per the post's own breakdown.
- The remaining eight chains — Arbitrum, Starknet, Abstract, OP Mainnet, Linea, ZKsync Era, Ink, and Mantle — split just $713K.
- Arbitrum sits third at $402K, described in the post as a tenth of Robinhood's early-stage revenue number.
- The bottom five chains (OP Mainnet, Linea, ZKsync Era, Ink, Mantle) each generate under $40K, a gap of two to three orders of magnitude versus the leaders.
How do the top 10 Ethereum L2 chains rank by revenue?
The table below reproduces the full DefiLlama snapshot cited in the original post, ranking chains from Robinhood Chain at $3.21M down to Mantle at $5.0K. The spread between first and tenth place spans more than three orders of magnitude, illustrating how concentrated L2 revenue currently is around two dominant players.
| Rank | Chain | Revenue |
|---|---|---|
| 1 | Robinhood Chain | $3.21M |
| 2 | Base | $2.06M |
| 3 | Arbitrum | $402K |
| 4 | Starknet | $133K |
| 5 | Abstract | $88.3K |
| 6 | OP Mainnet | $37.7K |
| 7 | Linea | $32.6K |
| 8 | ZKsync Era | $8.5K |
| 9 | Ink | $7.6K |
| 10 | Mantle | $5.0K |
Why is Robinhood Chain ahead of Base and Arbitrum?
Robinhood Chain's lead comes down to distribution: it launched with access to roughly 25 million existing retail users who did not need to learn crypto workflows to start transacting on-chain. That built-in user base lets the chain generate $3.21M without competing for the same crypto-native liquidity that Base, Arbitrum, and other L2s chase.
Base, by contrast, built its $2.06M revenue base primarily through crypto-native activity funneled from Coinbase's existing exchange relationships and onchain app ecosystem. Arbitrum's $402K reflects a more mature, fee-competitive environment where sequencer revenue has compressed as more L2s split the same transaction volume. The post frames Arbitrum's number as a tenth of Robinhood's own early-stage revenue, a sharp reminder that first-mover status in the rollup race does not guarantee revenue leadership once distribution-heavy entrants arrive.
What does L2 revenue actually measure?
L2 revenue is what a rollup keeps after paying Ethereum for data availability — it is the net amount the chain's operator retains, not gross fees collected from users. This distinguishes revenue from raw transaction fee volume, since a chain can process significant activity yet still post modest revenue if a large share of user fees passes through to Ethereum as data availability costs. Because of this, revenue is often used as a rough proxy for how sustainable a chain's economics are independent of token incentives or subsidized gas.
This distinction matters when comparing chains like Robinhood and Base against smaller L2s such as ZKsync Era ($8.5K) or Mantle ($5.0K). A chain generating a few thousand dollars in revenue could still carry meaningful transaction volume; the metric isolates profitability rather than usage scale. Readers evaluating L2 health should pair revenue figures with TVL and active user counts rather than relying on revenue alone.
What explains the 84% concentration among just two chains?
The concentration stems from a distribution gap rather than a technology gap — both Robinhood Chain and Base tap into pre-existing, large-scale consumer platforms (Robinhood's brokerage app and Coinbase's exchange, respectively) that funnel users onto their L2s without requiring separate crypto onboarding. This gives them a revenue advantage that purely crypto-native L2s like Starknet or Linea, which must acquire users organically, cannot easily replicate in the near term.
The remaining eight chains combined generate $713K, less than a quarter of Robinhood's number alone. That gap suggests the L2 landscape is bifurcating into a small tier of consumer-fintech-backed chains and a long tail of technically differentiated but revenue-thin networks. Following DEX and chain revenue trends closely will show whether this gap narrows as more consumer platforms launch their own rollups, or whether the incumbents' user-base advantage compounds further.
Bottom line
The April 12, 2026 DefiLlama snapshot shows Ethereum L2 revenue heavily concentrated at the top, with Robinhood Chain's 25-million-user head start translating directly into a $3.21M lead over Base's $2.06M. Arbitrum's fall to $402K — a tenth of Robinhood's early number — signals that first-mover rollups are losing ground to distribution-backed entrants. Watching whether Base narrows the 56% gap, or whether new consumer-platform chains enter the top 10, will be the key signal for how this hierarchy evolves.
Frequently Asked Questions
1.Which Ethereum L2 generates the most revenue?
Robinhood Chain generates the most revenue among Ethereum layer-2 networks, posting $3.21M according to DefiLlama data as of April 12, 2026. That is 56% more than second-place Base, which recorded $2.06M.
2.What does L2 revenue actually measure?
L2 revenue is what a chain keeps after paying Ethereum for data availability, meaning it isolates the sequencer's net take rather than gross fees collected from users. It is a proxy for how profitable running the chain is, not how much activity happens on it.
3.How much of total top-10 L2 revenue do Robinhood and Base control?
Robinhood and Base together account for roughly 84% of the combined revenue generated by the top 10 Ethereum L2 chains, per the post's figures. The remaining eight chains — including Arbitrum, Starknet, and Abstract — split just $713K between them.
4.Why is Arbitrum's revenue so much lower than Robinhood's?
Arbitrum's $402K in revenue reflects a maturing, fee-competitive L2 market rather than a new user influx, while Robinhood Chain benefits from an existing base of 25M retail users migrating onto its chain. The post notes Arbitrum's figure is a fraction of Robinhood's early revenue, underscoring how distribution advantages can outweigh incumbency.
5.Where does this Ethereum L2 revenue data come from?
The figures come from DefiLlama, as cited in the original Top 7 post dated April 12, 2026. The dataset covers the top 10 Ethereum L2 chains by revenue at that snapshot in time.
Sources
DefiLlama